Feature Visualization
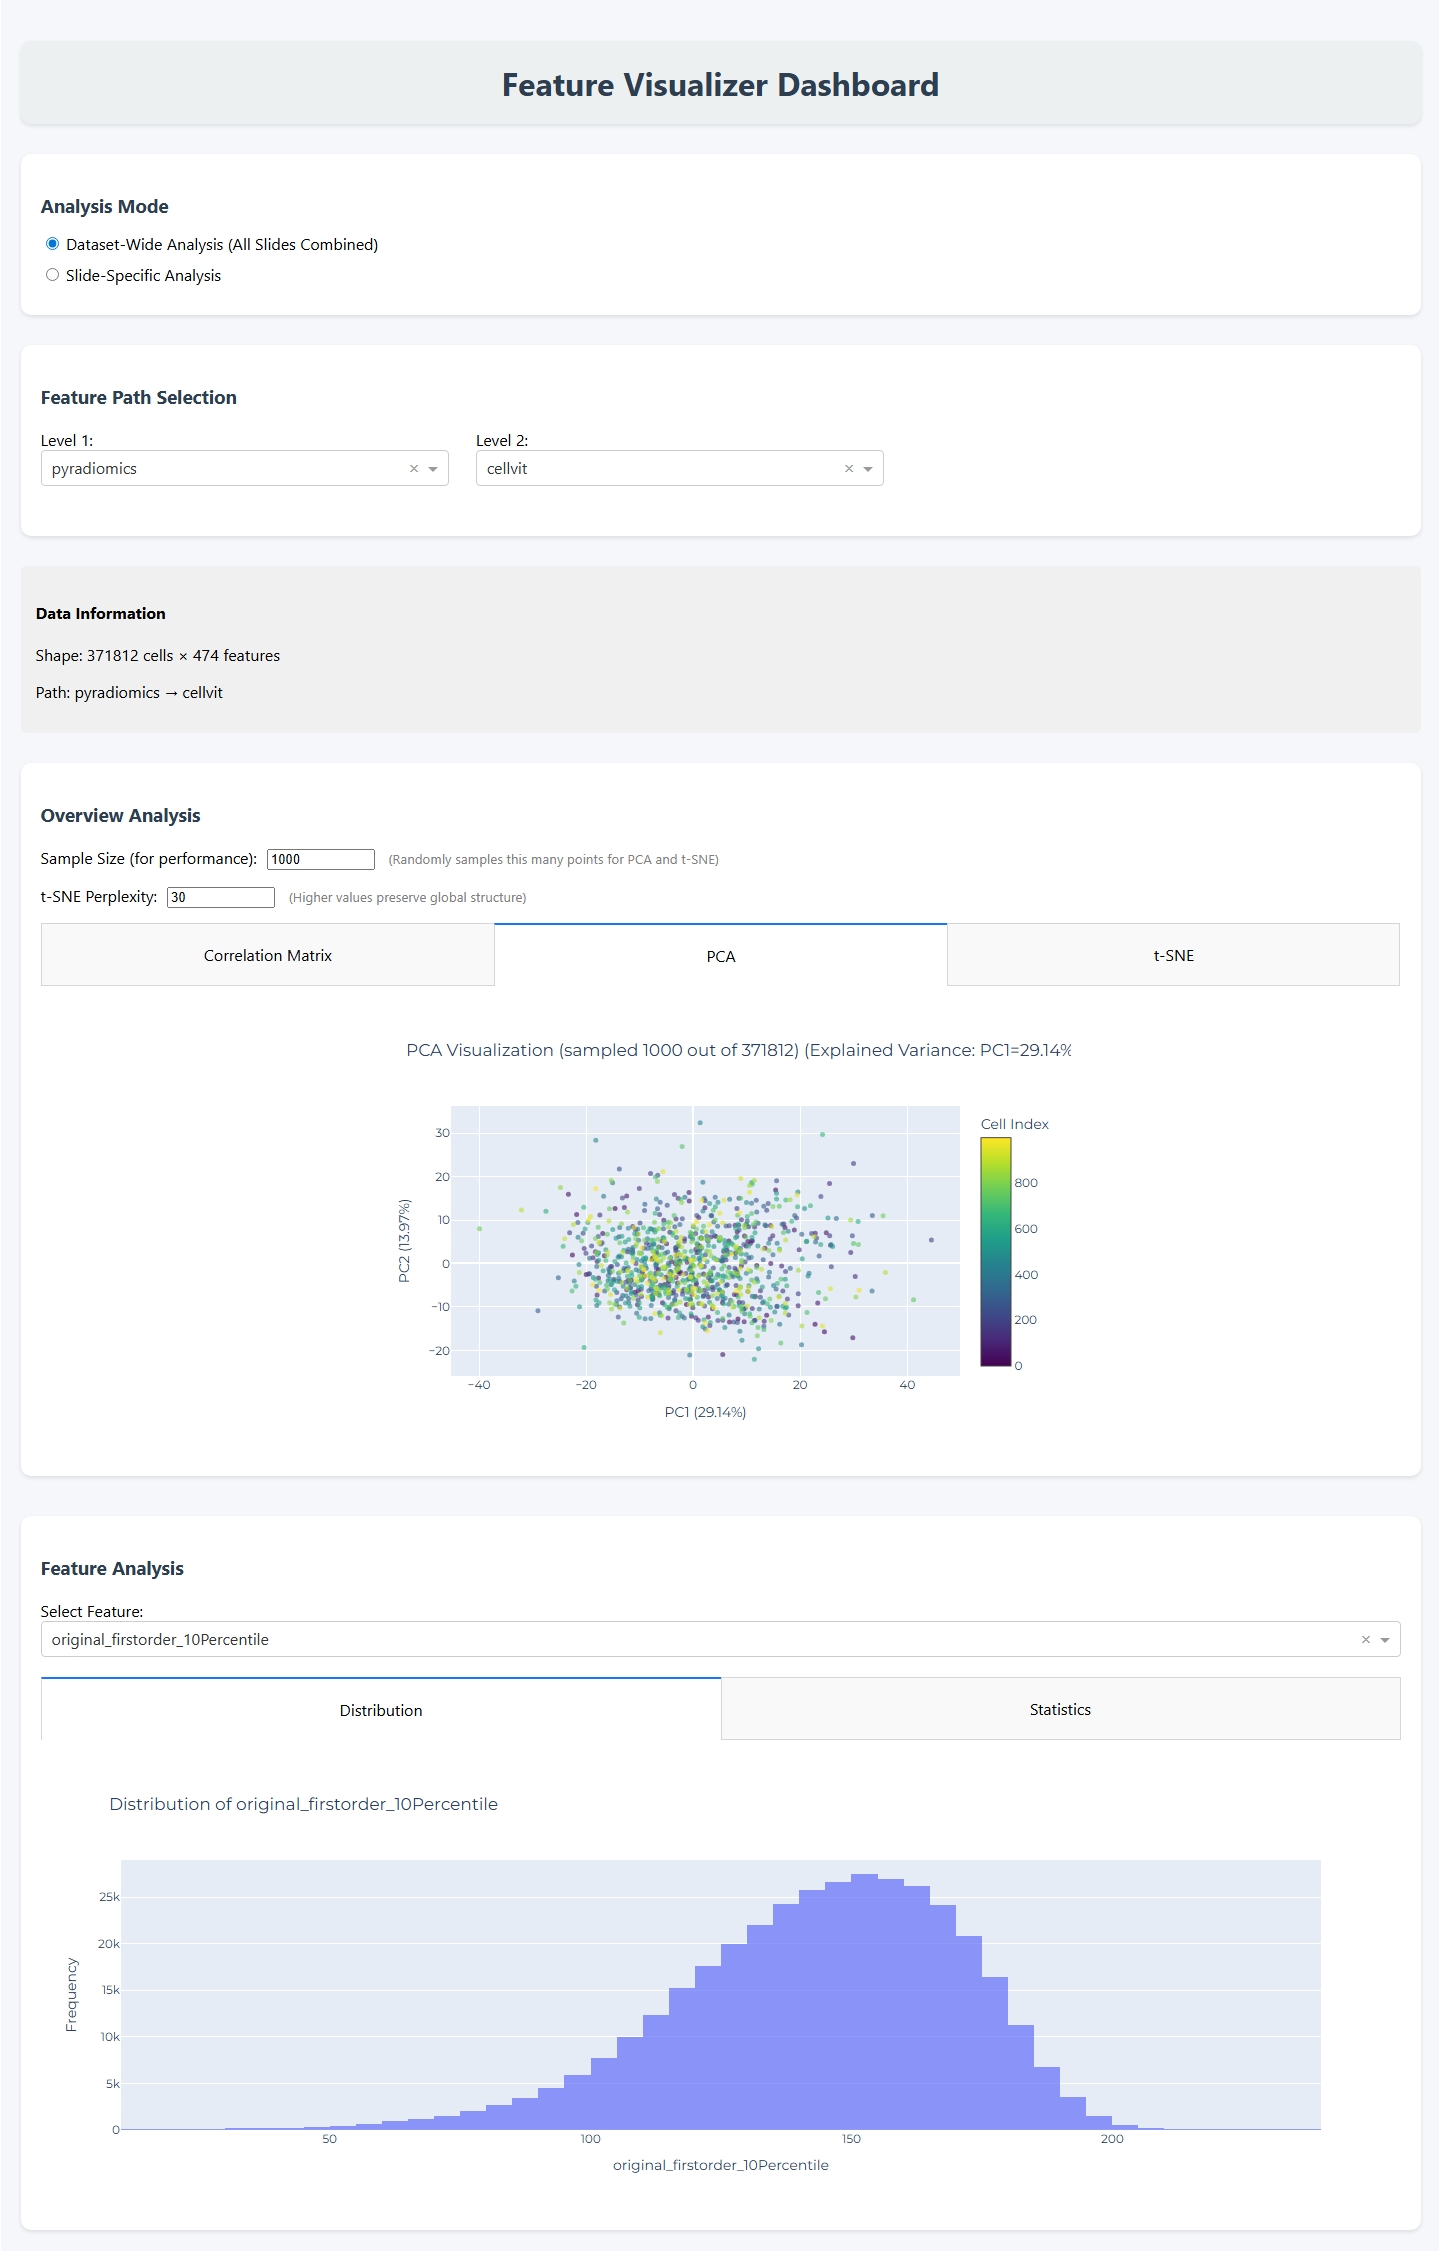
The feature visualization tool provides interactive visual analysis and statistical exploration of extracted features from your dataset. It enables comprehensive examination of feature distributions, correlations, dimensionality reduction, and cell-type-specific patterns through an interactive web interface.
Overview
Feature visualization helps you understand the characteristics and quality of your extracted features before training MIL models.
The tool provides:
Statistical descriptors: Mean, median, standard deviation, skewness, and kurtosis
Distribution analysis: Histograms and kernel density estimates
Correlation analysis: Feature correlation matrices
Dimensionality reduction: PCA and t-SNE visualizations
Cell-type analysis: Cell type distributions and feature comparisons across cell types
Multi-slide analysis: Combined visualizations across entire datasets
CLI Usage
Basic Command
vis_features --dataset PATH
Required Arguments
- --dataset PATH
Path to the dataset folder containing slides with extracted features. This should be the output directory from feature extraction or dataset creation steps.
Complete Example
vis_features --dataset ./results/my_dataset
This command will:
Launch an interactive web application at
http://127.0.0.1:8050Scan the dataset for available slides and feature extraction outputs
Provide interactive controls to navigate through different feature sets
Generate visualizations on-demand based on your selections
See Also
Feature Extraction: Extract features before visualization
Dataset Creation: Create organized datasets for analysis
cellmil.visualization: API reference for the visualization module