Feature Extraction
The feature extraction tool extracts features from segmented cells. This is the third step in the pipeline, transforming cell masks and detection into quantitative feature vectors for downstream analysis.
Overview
Feature extraction bridges the gap between visual cell segmentation and quantitative analysis. It computes numerical descriptors that capture cell morphology, intensity patterns, and texture characteristics, enabling machine learning and statistical analysis.
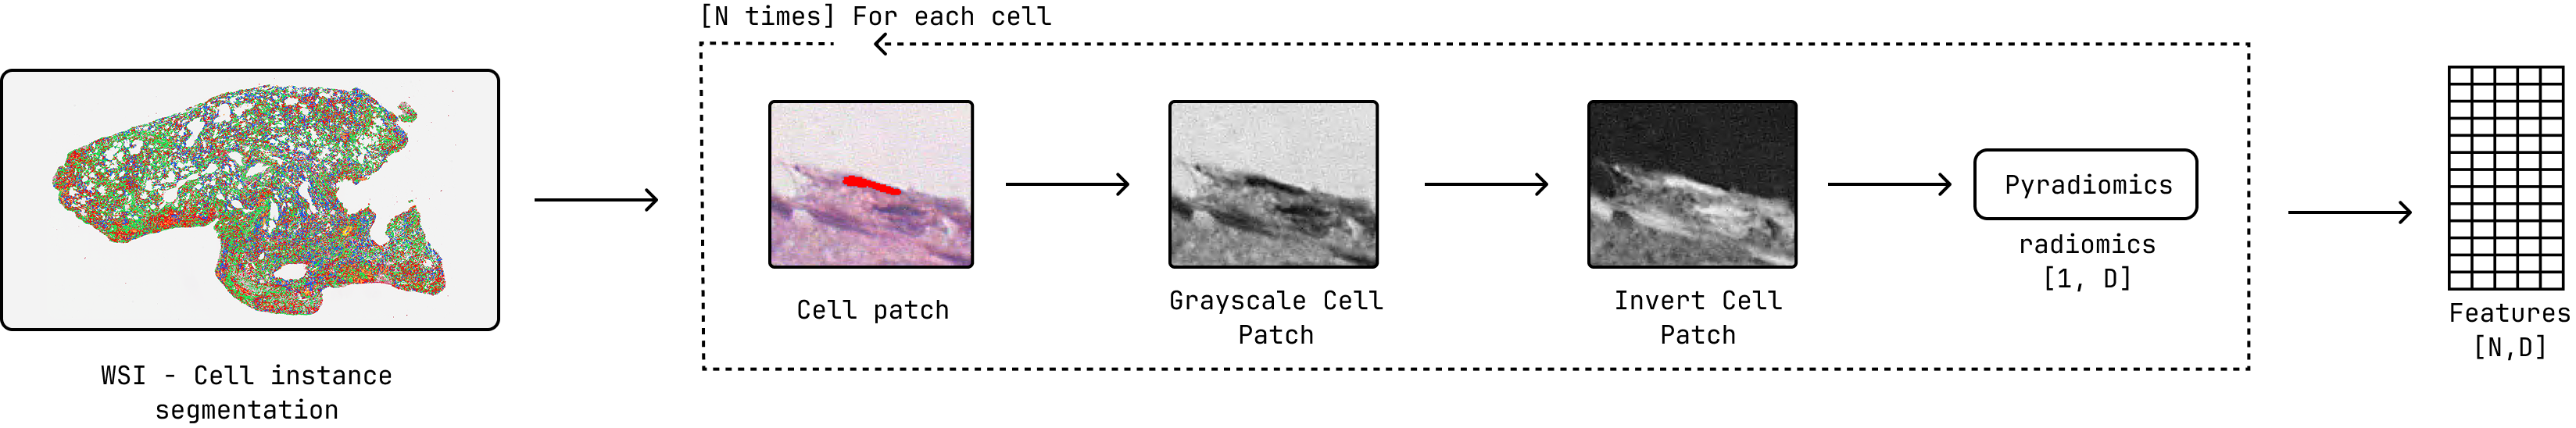
Feature extraction pipeline overview, highlighting the use of PyRadiomics for feature computation with Gray Scale preprocessing.
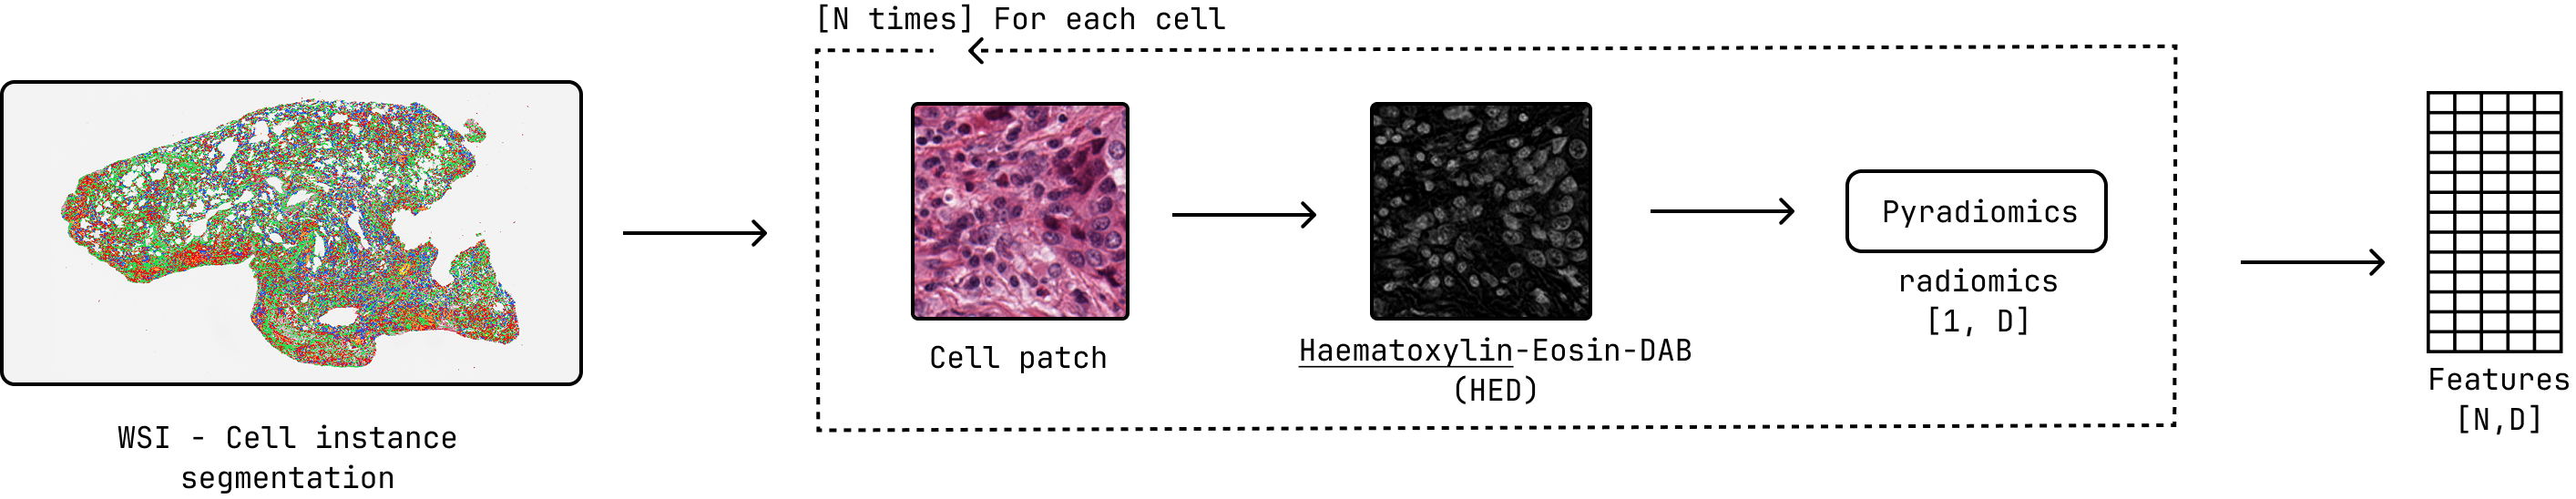
Feature extraction pipeline overview, highlighting the use of PyRadiomics for feature computation with HED decomposition preprocessing.
Available Extractors
PyRadiomics [1]
Comprehensive radiomics feature extraction based on the PyRadiomics library (102 features).
- Shape Features (7 features)
Area: Number of pixels in the cell maskPerimeter: Length of cell boundarySphericity: How sphere-like the cell isCompactness: Ratio of area to perimeter squaredMaximum2DDiameter: Largest distance between boundary points
- First Order Features (18 features)
Mean: Average intensity within cellStandardDeviation: Intensity variationSkewness: Asymmetry of intensity distributionKurtosis: Peakedness of intensity distributionEntropy: Randomness of intensity values
- Texture Features (70+ features)
GLCM: Co-occurrence patterns
GLRLM: Run-length patterns
GLSZM: Size zone patterns
NGTDM: Neighboring tone differences
GLDM: Dependence patterns
Morphometrics
Morphological features based on established cellular analysis literature (13 features).
- Features:
axial_ratio: Ratio of bounding box width to heightaspect_ratio: Ratio of major to minor axis of fitted ellipseeccentricity: Ratio of minor to major axis lengthrectangular_factor: Area divided by product of major and minor axis lengthselongation_index: Log2 of major to minor axis length ratiodispersion_index: Log2 of π × major_axis × minor_axiscircularity: 4π × area / perimeter²roundness: Perimeter / √(4π × area)roundness_factor: 4 × area / (π × max_diameter²)convexity: Convex hull perimeter / perimeterspreading_index: (π × convex_hull_perimeter) / (4 × convex_hull_area)irregularity_index: Max diameter / inscribed circle diametersolidity: Cell area / convex hull area
Reference: Functional Morphometric Analysis in Cellular Behaviors: Shape and Size Matter
Connectivity
Connectivity features based on the spatial graph of segmented cells (5 features).
- Features:
degree: Number of adjacent cells (graph degree)weighted_degree: Sum of edge weights (distance-based)k_core_number: Maximum k-core value for the cell in the graphpagerank: PageRank centrality scoreeigenvector_centrality: Eigenvector centrality (approximate)
Geometric
Geometric features based on cell shape and arrangement (10 features).
- Features:
distance_to_nearest_neighbor: Minimum distance to another cellmean_distance_to_neighbors: Mean distance to all neighborsedge_length_variance: Variance of edge lengths to neighborsanisotropy: Dominant direction of nearest neighborslocal_density: Number of cells within a fixed radiusspatial_entropy_of_neighbors: Entropy of neighbor spatial distributionlocal_convex_hull_shape: Shape descriptor of local convex hullarea_perimeter_ratio_local_neighborhood: Area/perimeter ratio of local neighborhoodnucleus_size_relative_to_local_density: Nucleus size normalized by local densityrelative_orientation_of_neighbors: Orientation difference between cell and neighbors
ResNet50 [2]
ResNet50 is a deep residual network that can be used for feature extraction from images. In the context of this package, it is applied to the patches extracted from whole slide images to obtain high-level embeddings. (1024 features) We take the output from the stage 3 convolutional block.
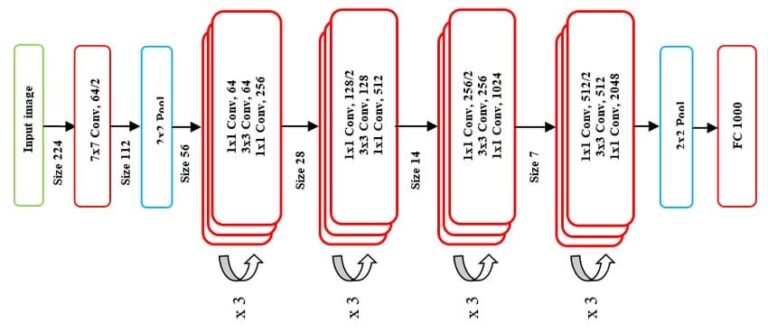
ResNet50 model architecture.
Prov-Gigapath [3]
Prov-Gigapath is a foundational model specifically designed for analyzing gigapixel pathology images.
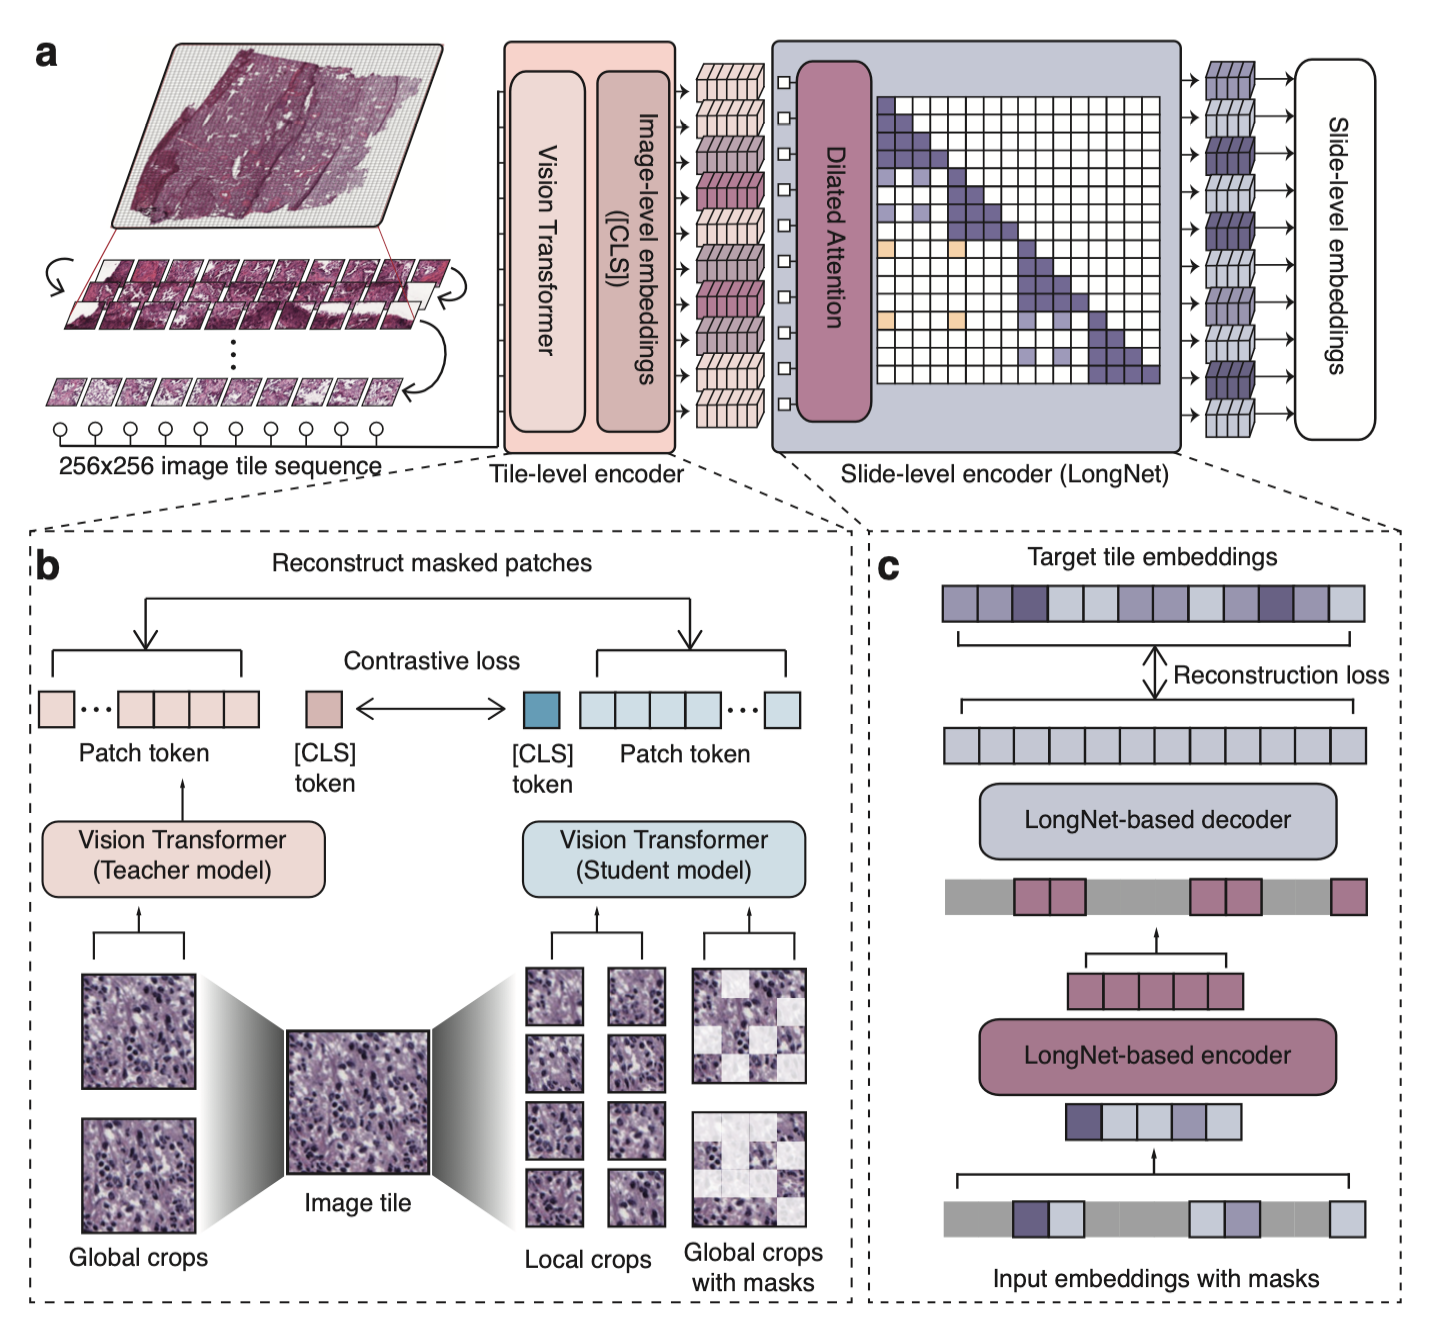
Prov-Gigapath model architecture.
UNI [4]
UNI is a general-purpose self-supervised vision transformer model pretrained on over 100 million images from diverse tissue types and organs. It provides robust embedding features suitable for pathology image analysis. (1536 features)
CLI Usage
Note
⭐ indicates recommended options based on best practices and empirical results.
Basic Command
feature_extraction [OPTIONS]
Required Arguments
- --extractor {pyradiomics_gray, pyradiomics_hue, pyradiomics_hed, morphometrics, connectivity, geometric, resnet50, gigapath, uni}
Feature extraction method to use.
Morphological extractors:
pyradiomics_gray: Comprehensive radiomics features with gray-scale preprocessingpyradiomics_hed: ⭐ Recommended. Radiomics features from Hematoxylin channelpyradiomics_hue: Radiomics features with Hue channel preprocessingmorphometrics: Morphological shape features
Topological extractors:
connectivity: Topological features based on cell connectivitygeometric: Geometric features based on graph geometry
Deep learning extractors:
resnet50: ResNet50 embedding featuresgigapath: Prov-GigaPath embedding featuresuni: UNI embedding features
- --wsi_path PATH
Path to the original whole slide image file.
- --patched_slide_path PATH
Path to the directory containing segmentation results.
- --segmentation_model {cellvit,hovernet,cellpose_sam}
The segmentation model used in the previous step. Must match the model used for cell segmentation.
..option:: –graph_method {knn, radius, delaunay_radius, dilate}
Method for constructing the cell adjacency graph.
Complete Example
feature_extraction \
    --extractor pyradiomics_hed \
    --wsi_path ./data/SLIDE_1.svs \
    --patched_slide_path ./results/SLIDE_1 \
    --segmentation_model cellvit \
    --graph_method delaunay_radius
This command will:
Load cell masks from
./results/SLIDE_1/cell_detection/cellvit/Extract PyRadiomics features from each segmented cell using HED preprocessing (recommended).
Save feature vectors to
./results/SLIDE_1/feature_extraction/pyradiomics_hed/cellvit/
Python API Usage
You can also extract features programmatically:
from cellmil.features import FeatureExtractor
from cellmil.interfaces import FeatureExtractorConfig
from pathlib import Path

# Create configuration
config = FeatureExtractorConfig(
    extractor="pyradiomics_hed",
    wsi_path=Path("./data/SLIDE_1.svs"),
    patched_slide_path=Path("./results/SLIDE_1"),
    segmentation_model="cellvit",
    graph_method="delaunay_radius"
)

# Initialize extractor
extractor = FeatureExtractor(config)

# Extract features
features = extractor.get_features()

# Features are returned as a tensor of shape [N, D]
# where N is the number of cells and D is the number of features
print(f"Extracted features for {features.shape[0]} cells")
print(f"Feature dimensionality: {features.shape[1]}")
Output Structure
Feature extraction creates the following structure:
patched_slide_path/
└── feature_extraction/
    └── {extractor_name}/
        └── {segmentation_model}/
            └── features.pt         # Feature tensor [N, D]
File Descriptions
- features.pt
- PyTorch tensor containing a dictionary with:
features: Shape: [N, D] where N = number of cells, D = number of features
feature_names: List of feature names
cell_indices: List of cell indices mapping cell_id -> index in feature matrix
Can be loaded with
torch.load()
Quality Control
Feature Validation
The tool performs automatic quality checks:
Cell size validation: Filters cells below minimum size threshold
Mask integrity: Ensures cell masks are valid
Feature validity: Checks for NaN or infinite values
Extraction success: Verifies successful feature computation
Quality Metrics
Generated quality metrics include:
Number of cells processed successfully
Number of cells filtered out
Feature extraction success rate
Processing time statistics
Data Analysis
For statistical analysis and visualization of extracted features, you can refer to the visualization tools provided in the package. See CLI Tools. Which includes:
Feature distribution plots: Histograms and boxplots for feature distributions
Correlation matrices: Heatmaps to visualize feature correlations
Dimensionality reduction: PCA to visualize feature space
Integration with Pipeline
Feature extraction output is used by:
MIL Prediction: Features serve as input to multiple instance learning models
Visualization: Feature distributions and patterns can be visualized
ML Training: Features are used to train classification models
The standardized tensor format ensures compatibility with PyTorch-based models.
See Also
Cell Segmentation - Previous step in the pipeline
cellmil.features - API documentation
Quick Start - Complete pipeline overview